


At a Glance
- NO COST – FREE Downloadable Software
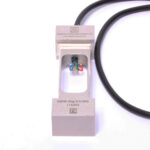
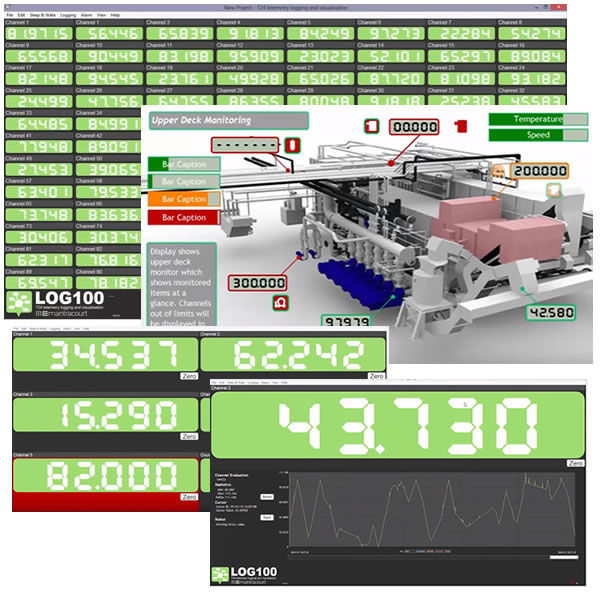
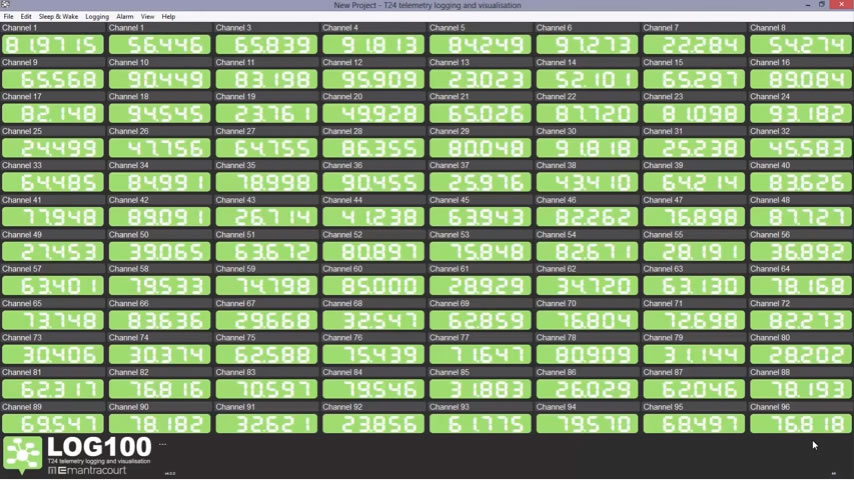
- Displays and logs data from up to 100 wireless sensor transmitters from our T24 wireless range
- Mapping / graphical capabilities
- Centre of Gravity (COG) function
- Webserver offers remote viewing on iPads/tablets/smart phones and also supplies JSON data on demand
- Create reports for your customers and develop custom projects
- Windows 7, 8, 10, 11 (32 bit software runs on 32 bit or 64 bit OS)
- Defined algorithms and maths function
- Logging at timed intervals, manual or on overload / underload
- Visual and audible alarms indicates over and under load
- Visual alarm for low batteries and loss in communication
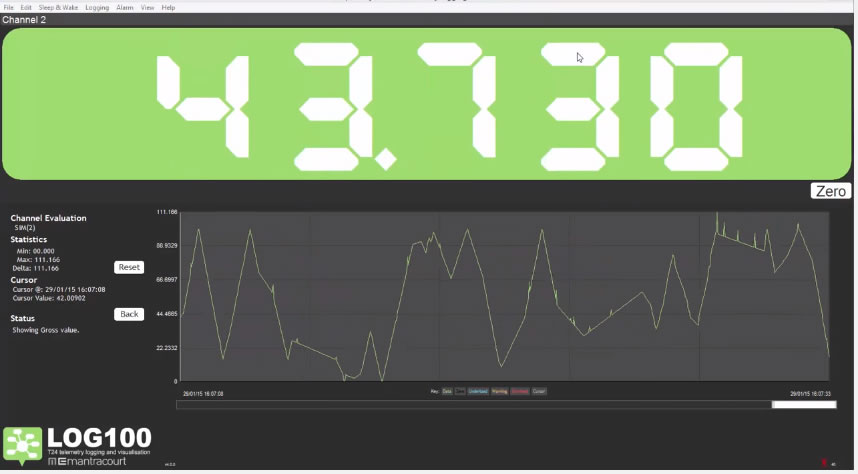
- Zoom in to channel to see data trends and history
- Quick & easy to install
- Export and log data in CSV format
- Centre of Gravity designer and functionality
- Customisable logo and colour scheme for integrating into your brand is available
Description
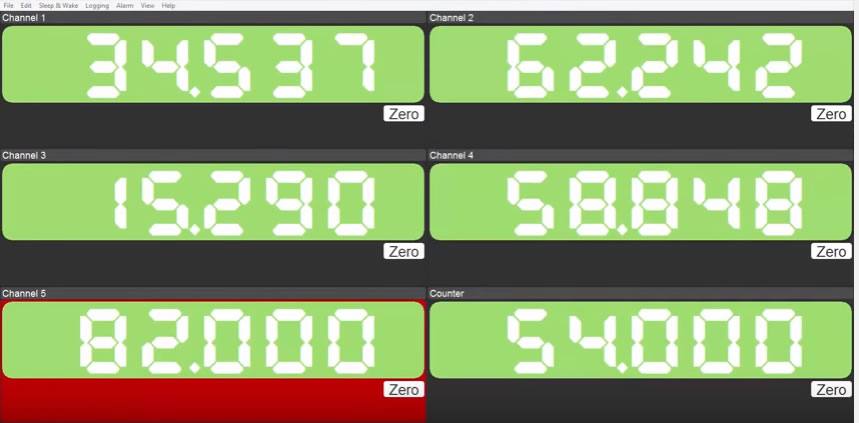
The T24LOG100 wireless data logging software is FREE to download and is designed for use with ALL T24 telemetry instrumentation. The software enables the viewing and logging of up to 100 channels of data. Various maths functions can be setup on separate channels with user defined algorithms, for example, a display can show the value from a single T24 transmitter module or the sum of multiple transmitters. The data can then be displayed on multiple devices on the same network via built-in web server, plus it can also supply JSON data on demand.
With the T24LOG100 FREE downloadable software you can set automatic logging or logging at pre-set intervals, on entering and leaving a pre-set overload and also during an overload. The data is saved in a CSV file for spreadsheet import allowing you to view and manipulate in MS Excel and other spreadsheet and data analysis programs.
The easily configurable T24LOG100 wireless data logging software allows you to configure alarm functions for individual channels. These can be both visual and audible.
The graphics function in the software allows you to import drawings, images and schematics to build a live visual representation of the data. The data can be displayed in a variety of formats including digital displays and bars. Supported image formats include JPG, GIF, PDF and DXF. These images can also be incorporated into the reports generated by the T24LOG100 software. Customised company branding is available as an optional extra including company logo, colour scheme and your contact details.
The T24LOG100 FREE downloadable software is compatible with Windows XP, Vista, Windows 7, 8, 10 and 11. Please contact our sales team for more information.
Technical Specifications
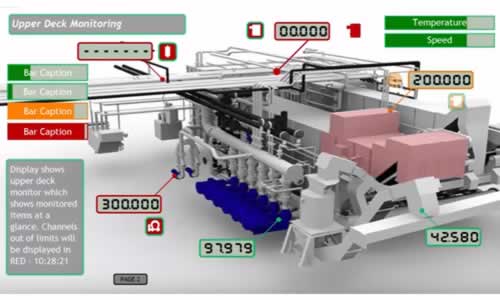
Graphics Function Enables Creation of Live Visual Representation
By uploading a visual graphic i.e picture, drawing or schematic, the T24LOG100 FREE downloadable software enables you to display a live visual representation of the data. Supported image formats include JPG, GIF, PDF, DXF.
Due to our policy on ongoing development, dimensions and specifications may change without notice.
Downloads
Other Downloads
Software downloads to accompany the T24 modules are available below - a T24 base station is required to use the software and configure T24 modules.
Download Description T24 Toolkit This toolkit allows configuration, calibration and testing of the T24 range of 2.4GHz telemetry products. The T24 Toolkit is a software tool that allows communication with the T24 range of 2.4GHz telemetry products. A suitable telemetry to PC interface will be required such as a base station (T24-BSue). T24Log100 T24LOG100 has been designed to allow the logging and visualisation of up to 100 channels of data from the T24 Wireless Telemetry range of sensor transmitters. T24 Quick View This product allows you to view and log data from the T24 range of 2.4GHz telemetry acquisition modules. Only works with T24-BSu USB base station.
Case Studies
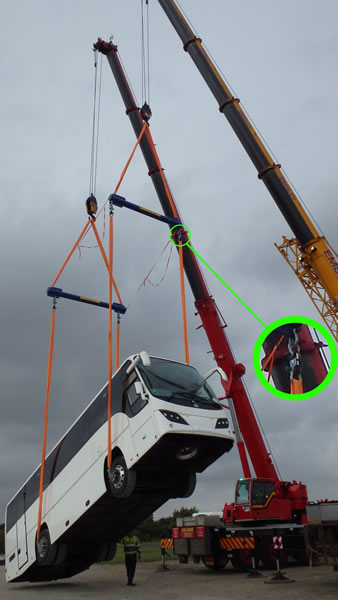
Telemetry Lift Link Load Cells Tip the Scales for Plaxton Bus
A multi-channel system was set up using two ET24-5T and two ET24-12T telemetry lift link load cells, two inclinometers (angle sensors) and a T24-BSu base station. ET24 telemetry load cells were attached to each corner of the bus to monitor the load and the two inclinometers were used to measure the incline. Once the bus was lifted, instantaneous measurements were picked-up by a T24-BSu wireless telemetry base station and the data was transmitted straight to the PC or laptop.
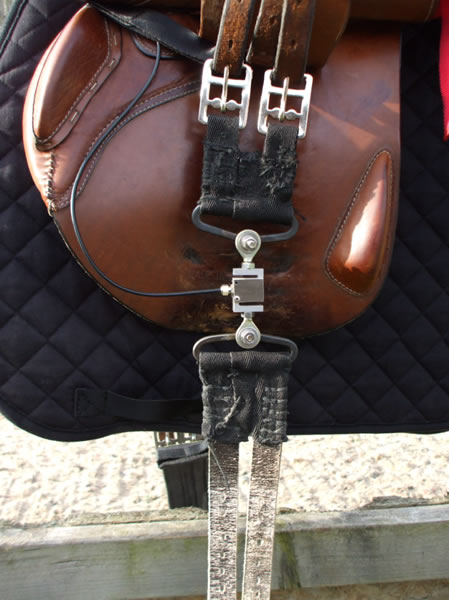
Force Measurement Determines The Effect of Girth Tension on Horse Gait
Using electrical systems for the measurement of mechanical forces is by no means limited to machines and laboratory based applications. In her recently completed research thesis ‘Girth Tensions and their Effects on Equine Stride Characteristics’, Sue Wright of Moulton College Northampton used load cells, motion sensors and GPS amongst other technologies to measure and record the tension within the girth strap used to hold the saddle in place.
Why Applied Measurements?
- Suppliers of top quality strain gauge sensors and transducers to every corner of industry - UK and worldwide
- Over 100 years of expert transducer knowledge
- Our high quality products all come with a 3 year warranty
Popular Products
 Platform Load Cell | Single Point Load Cell | 0-250g to 0-40kg | OBUG0-250g to 0-40kgFrom £128Buy Online
- Pancake Load Cell | Low Profile Force Sensor | DSCC0-5kN up to 0-1000kNFrom £651Buy Online
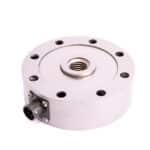
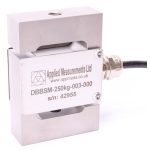
- Universal Load Cell | Universal S-Beam Force Sensor | DBBSM0-1kg up to 0-30,000kgFrom £269Buy Online
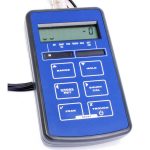
- Handheld Load Cell Indicator | Digital Display | TR150From £495Buy Online
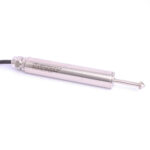
- Strain Gauge Displacement Sensor | Linear Position Sensor | AML/SGD0-5mm to 0-100mmFrom £429Buy Online